The Age of Constraint: When the Energy Transition Becomes a Race Against Its Own Success
Imagine a solar panel factory in Bavaria shutting down in 2025 despite record demand for clean energy. Not because the technology doesn't work. Not because customers aren't buying. Because the factory can't compete with Chinese production costs — energy prices are five times higher in Germany, labour costs are five times higher, and the critical PV wafer manufacturing step has 95% concentration in China. The energy transition has crossed the economic tipping point, but the race is being run on an uneven track.
The International Energy Agency's Energy Technology Perspectives 2026 (ETP 2026), published on March 26, 2026, documents a remarkable threshold. The global clean energy technology market reached USD 1.2 trillion in 2025, now rivalling the entire crude oil market in value. 80% of global solar PV and wind generation occurs at lower levelised costs than coal or gas. Battery prices have fallen 75% over the past decade, making both electric vehicles and grid-scale storage commercially viable without subsidies in many markets.
The economics work. The technology is proven.
Yet the report's core message is not celebration — it is constraint. Supply chains are concentrated (China controls 85-97% of solar and battery supply chains). Infrastructure is lagging (the Net Zero by 2050 scenario requires 2 million kilometres of grid expansion per year, roughly 60% above current investment levels). Policy execution is fragmented (90% of announced carbon capture projects remain stuck before final investment decision).
> "The energy transition is no longer constrained by what we can build, but by what we can build fast enough — and whether supply chains are resilient enough, supported by policy coherent enough."
The transition has moved from "can we?" to "can we fast enough?" This is the Age of Constraint.
The Economic Tipping Point: Technology Is Ready
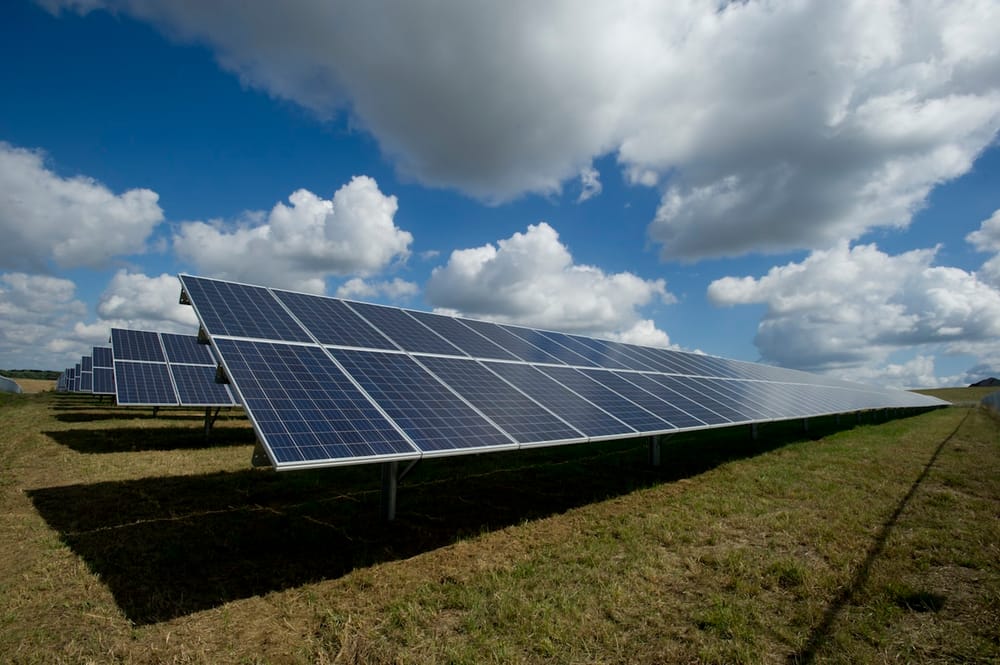
Clean energy has crossed from subsidy-dependent to economically competitive. The mature trio — solar photovoltaics, wind power, and lithium-ion batteries — is no longer the future. It is the present.
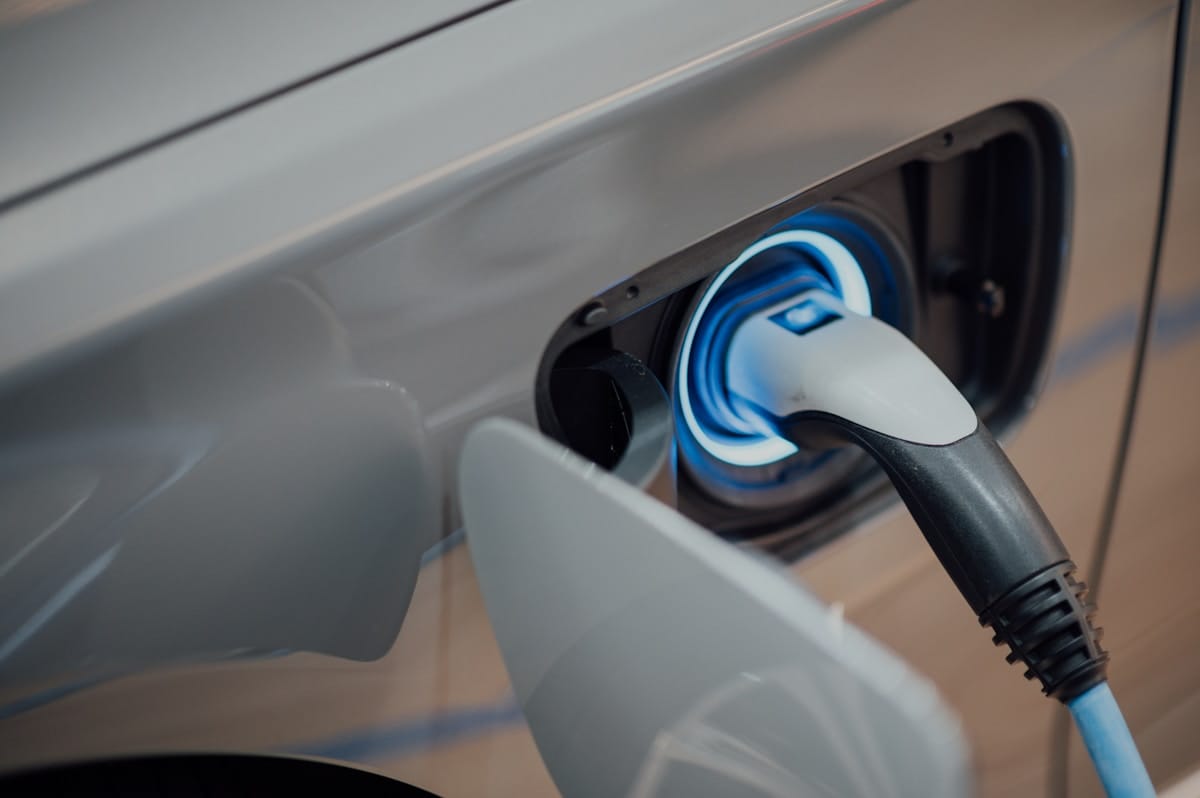
80% of global solar PV and wind generation is now cheaper than coal or gas. Battery prices have fallen 75% in ten years, eliminating the cost barrier for electric vehicles in most markets. The EV market share reached approximately 25% of global car sales in 2025, and electric vehicles represent roughly three-quarters of the projected 2035 clean energy market value across all IEA scenarios.

The numbers are striking. The clean energy technology market grew at 20% annually over the past decade. By 2035, under the IEA's Stated Policies Scenario (STEPS) — the "most likely" trajectory based on current momentum and announced but not yet implemented policies — the market will reach USD 3 trillion. That is three times the size of the global crude oil market today.
Heat pumps, often overlooked in clean energy discussions, have quietly become a USD 50 billion market (2024), comparable to solar PV modules in value. Global production capacity stands at approximately 145 gigawatts, with China (35%), the United States (25%), and the European Union (20%) as leading manufacturers. The IEA projects heat pumps to become the dominant heating technology in buildings by 2035 in advanced economies, with US capacity growing more than 100% and Chinese capacity climbing 80% by 2035.
Low-emissions hydrogen is growing rapidly from a small base. Investment climbed to USD 8 billion in 2025 — an 80% year-on-year increase. Electrolyser capacity has grown from 100 megawatts in 2009 to approximately 5 gigawatts by the end of 2025, with China accounting for roughly 40% of capacity. Committed projects represent 26 GW of electrolyser capacity by 2030, producing 4.2 million tonnes of hydrogen annually. If likely projects are included, that figure rises to 65 GW capacity and approximately 10 million tonnes per year.
But here is the policy divergence: the hydrogen market value is USD 55 billion in STEPS and USD 560 billion in the Net Zero Emissions by 2050 (NZE) scenario — a tenfold difference. The clean materials market (crucial for batteries, solar panels, and wind turbines) is 25 times larger in NZE than in STEPS.
> "The question is no longer whether clean energy technology works — it's whether deployment can accelerate fast enough to meet climate targets."
The maturity cascade is clear. Solar, wind, and batteries are no longer experimental — they are the default. Heat pumps are the "quiet revolution." Hydrogen is growing fast, but its trajectory is policy-dependent, not economically determined. The technology is ready. The question is whether governments, industries, and supply chains can execute at the speed the climate demands.
The Supply Chain Constraint: China's Structural Dominance
The biggest constraint is not technological but geopolitical-economic. China's dominance across key clean energy supply chains is structural, not temporary — a manufacturing reality driven by scale, cost advantages, and energy pricing that cannot be easily replicated elsewhere.
The concentration is staggering:
| Technology/Component | China's Share |
|---|---|
| Solar PV supply chain | ~85% |
| Li-ion battery supply chain | ~80% |
| PV wafers | 95% |
| Anode materials | 97% |
| Rotary compressors (heat pumps) | 90% |
| Lithium, cobalt, graphite, rare earths refining | >70% |
Chinese clean energy technology exports exceeded USD 165 billion in 2025, representing approximately 15% of China's trade surplus. By 2035, net exports are projected to reach USD 375 billion — roughly 10% of China's current total goods exports.
Every major clean energy supply chain has at least one step where less than 25% of non-China demand could be met outside China. A single facility in Inner Mongolia has capacity equivalent to the combined PV component demand of the European Union and India combined. This is not hyperbole — it is a manufacturing fact.
The economic impact of disruptions is severe. A one-month interruption in battery supply would result in USD 17 billion in losses for global electric vehicle production, with nearly two-thirds of the impact concentrated in the European Union. A solar supply chain disruption would cost approximately USD 1 billion per month in lost module output, with more than 40% of losses affecting Southeast Asia and India. Approximately 50% of clean energy technology trade passes through the Strait of Malacca — a single chokepoint for half the global flow.
Why China Dominates: The Cost Dissection
The IEA report dissects the cost competitiveness gap, finding multiple reinforcing factors that explain China's structural advantage:
| Manufacturing Segment | Primary Cost Drivers (EU vs. China) |
|---|---|
| Battery manufacturing | Efficiency/automation: >40% of gap |
| Solar PV upstream | Energy + labour costs: 65% of gap |
| Wind turbine blades | Energy + labour costs: 75% of gap |
| Heat pumps (air-to-water) | ~60% more expensive in EU |
Labour costs in China can be five times lower than in Europe or the United States. Electricity prices vary by a factor of seven across regions. The solar factory in Bavaria didn't close because German engineers couldn't build solar panels — it closed because Chinese facilities operate at ten times the scale with energy costs one-fifth the level and labour costs one-fifth the level. This is not a temporary condition. It is structural.
> "A single facility in Inner Mongolia has capacity equivalent to the combined PV component demand of the EU and India. The supply chain concentration is not a Chinese conspiracy — it is a manufacturing reality."
Pragmatic Mitigations: Strategic Partnerships, Not Autarky
But the report also documents realistic pathways to reduce vulnerability — not through full vertical integration (economically unviable for most regions), but through selective strategic partnerships:
- EU solar modules with North African wafers: Approximately 20% cost reduction compared to purely European production
- European wind turbines with Indian components: Only 15% more expensive than Chinese production, closing 75% of the cost gap
- India and Southeast Asia: Can produce polysilicon and wafers at China-comparable costs
- United States: Approaching self-sufficiency in downstream solar PV manufacturing by 2030, driven by Inflation Reduction Act (IRA) industrial policy
The tension is clear: the energy system is fragmenting politically (trade restrictions have nearly sextupled since 2015), but it remains deeply integrated economically. Only 15% of global clean energy imports come from countries with substantially higher tariffs. The challenge is balancing diversification with cost efficiency.
Strategic partnerships — targeted collaboration for specific supply chain steps — offer the realistic path. But this requires international cooperation at a time of rising trade barriers. The IEA's data suggests it can work: selective collaboration can close most of the cost gap while building resilience. The question is whether governments can execute this nuanced strategy rather than defaulting to protectionism or laissez-faire inaction.
The Infrastructure Constraint: The Forgotten Bottleneck
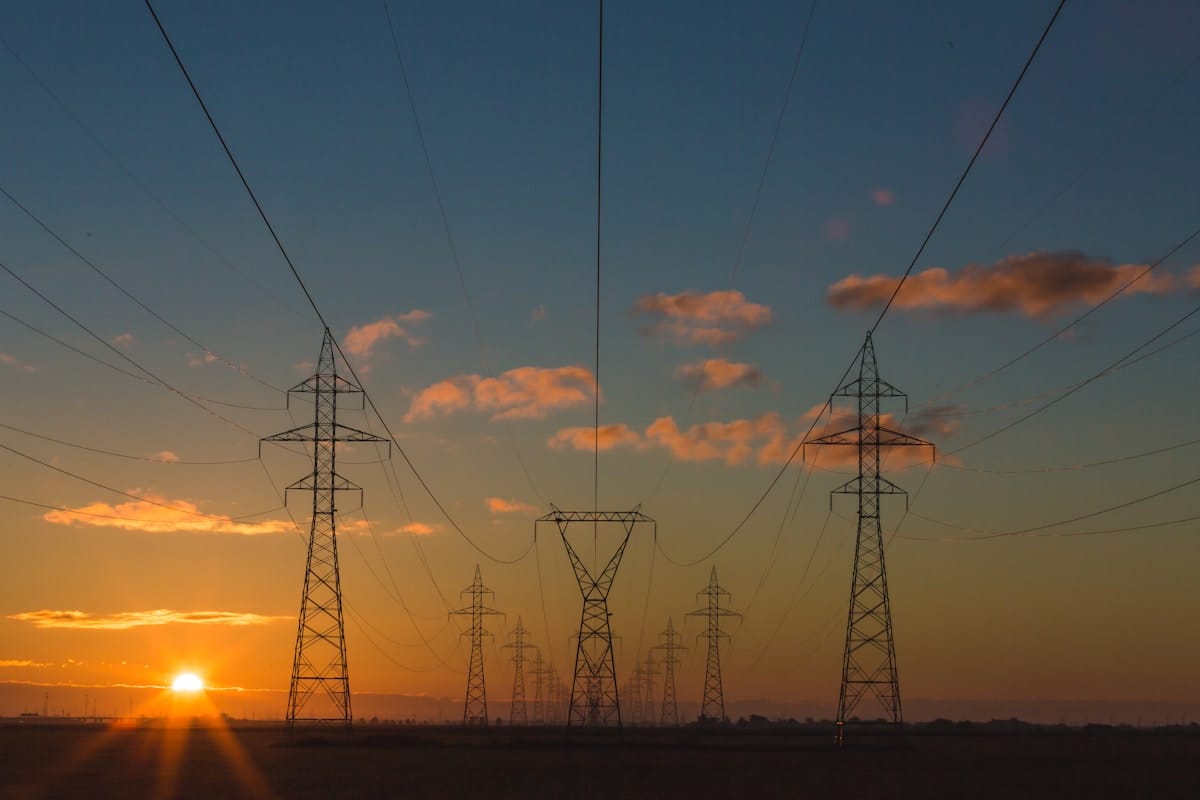
Even if supply chains are secured, grid infrastructure is the binding constraint. The NZE scenario requires approximately 2 million kilometres of new transmission and distribution network per year — a 60% increase over current investment levels. This is the forgotten bottleneck.
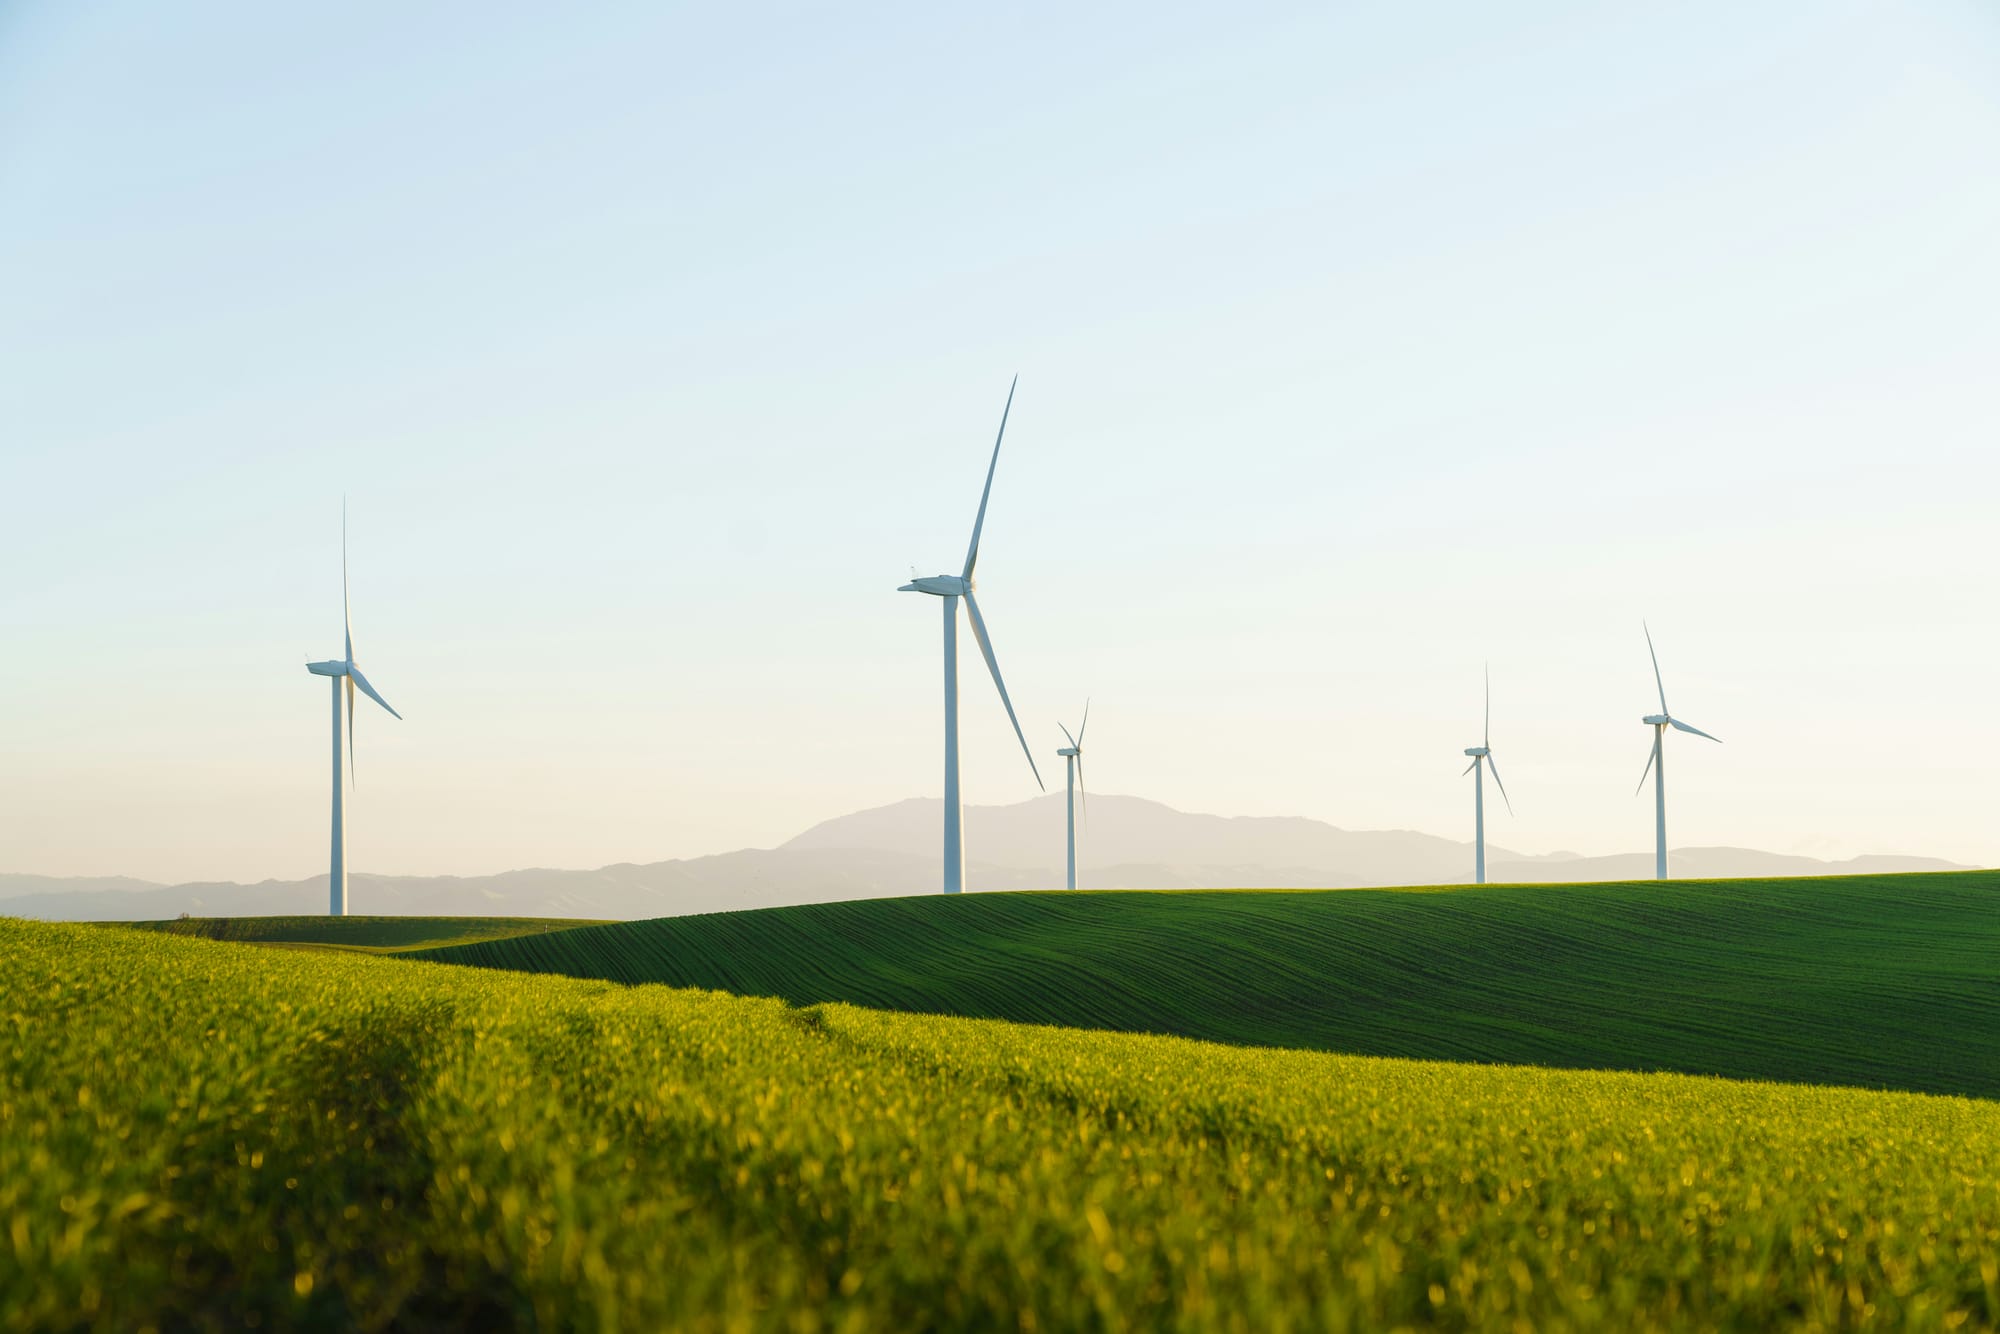
The scale is staggering. Solar capacity must increase 20-fold by 2050 (NZE). Wind capacity must increase 11-fold. Annual additions must reach 630 GW of solar PV and 390 GW of wind by 2030 — four times the record levels set in 2020. Grid-scale battery storage must expand six-fold to 1,500 GW by 2030.
Two million kilometres per year. That is the equivalent of circling the Earth 50 times annually. Or: building the entire current global transmission infrastructure every 15 years, continuously, without pause.
Solar panels are visible. Wind turbines are visible. But transmission lines, substations, and distribution upgrades? Invisible until they're not. The IEA data shows that grid capacity is increasingly the limiting factor on renewable deployment. You can build a wind farm in six months. Connecting it to the grid can take two years. Permitting delays, local opposition, underinvestment in transmission infrastructure — these are the unglamorous constraints that determine whether renewable energy can be deployed at the speed required.
Grid investment must rise approximately 60% above current levels. This is not a technical challenge — transmission technology is mature. It is a policy, financing, and coordination challenge. Governments must prioritise grid expansion with the same urgency they apply to renewable generation. Otherwise, solar farms and wind turbines will sit idle, waiting for grid connection.
> "The energy transition is no longer constrained by what we can build, but by what we can build fast enough — and grid infrastructure is the forgotten bottleneck."
The IEA's warning is implicit but clear: without grid infrastructure acceleration, renewable deployment will stall — not because the technology doesn't work, but because there is nowhere to send the electricity.
The Policy Gap: STEPS vs. NZE
The gap between "what is planned" (STEPS) and "what is needed" (NZE) is enormous. The IEA's three scenarios show that policy ambition, not technology readiness, determines outcomes.
Three scenarios, three futures:
- Current Policies Scenario (CPS): Projects forward based only on policies already implemented. The clean energy technology market grows to approximately USD 2 trillion by 2035 — significant growth, but insufficient for climate targets. Fossil fuel demand peaks but declines slowly.
- Stated Policies Scenario (STEPS): Incorporates announced but not yet implemented policies. Market value reaches approximately USD 3 trillion by 2035. This is the IEA's "most likely" trajectory — the world as it is heading based on current momentum and stated intentions.
- Net Zero Emissions by 2050 (NZE): A normative scenario describing a pathway to net-zero CO₂ emissions in the energy sector by 2050. Market value exceeds USD 5 trillion by 2035. Requires radical acceleration in deployment, investment, and policy support across all technology categories.
The divergence is stark. The hydrogen market is USD 55 billion in STEPS and USD 560 billion in NZE — a tenfold difference. The clean materials market is 25 times larger in NZE. Solar and wind's share of electricity generation is 17% today, projected to reach 27% by 2030 under STEPS, but must climb to approximately 70% by 2050 under NZE.
> "The hydrogen market is 10x larger in NZE; the clean materials market is 25x larger. Policy, not technology, is the decisive factor."
Carbon capture, utilisation, and storage (CCUS) exemplifies the policy execution gap. Investment has risen 15-fold since 2020 to over USD 5 billion annually. But approximately 90% of announced projects have not yet reached final investment decision (FID). CCUS remains essential for hard-to-abate industrial emissions (cement, steel) where electrification is insufficient, but its role is more modest than earlier IEA projections suggested — because projects are not moving from announcement to construction.
Regional Divergence: Who Leads, Who Lags
The policy gap manifests differently across regions:
United States: Approaching self-sufficiency in downstream solar PV manufacturing by 2030, driven by the Inflation Reduction Act. Largest heat pump market by value (USD 17 billion). Hydrogen-based steelmaking potentially cost-competitive with conventional methods. Near-shoring strategy showing measurable results in battery and EV manufacturing.
European Union: The Net-Zero Industry Act is in implementation, but targets are not being met in STEPS projections. Limited new solar manufacturing facility announcements. Structural cost disadvantage in energy-intensive manufacturing (energy prices significantly higher than China or the US). Most vulnerable to supply chain disruptions (two-thirds of battery supply loss impact would hit the EU). Strategic partnerships offer partial solutions, but execution is lagging.
India: Solar PV market share growing from 3% (2024) to more than 10% by 2035. Projected to become a net exporter of solar modules by 2030. Can potentially produce polysilicon and wafers at China-comparable costs. Hydrogen-based steelmaking potentially cost-competitive.
China: Continues to dominate manufacturing across all categories, but EV exports are being rerouted. Emerging economies now account for approximately 40% of Chinese EV exports (up from less than 5% in 2020) as advanced economies impose countervailing duties. EU duties help cap Chinese EV import share at approximately 20% through 2035. In Central and South America, Chinese EVs are projected to reach approximately 50% of total EV sales by 2035.
The regional divergence underscores that industrial policy matters. The United States is demonstrating that targeted financial support (IRA) can shift manufacturing trajectories within five years. India is leveraging cost advantages to build export-oriented solar capacity. The European Union is struggling with structural cost disadvantages and policy fragmentation. China's dominance persists, but trade policy is reshaping export destinations.
The technologies exist. The economics work. The question is whether governments can execute at the speed and scale required.
The Five Priorities: What the IEA Recommends
The IEA identifies five priority areas for accelerating the energy transition while managing constraints:
1. Industrial Competitiveness
Systematic financial support for domestic manufacturing investment, focusing on economies of scale, production efficiency innovation, and energy pricing. The cost gap with China is not primarily about technology — it is about manufacturing scale and input costs. Governments must address electricity pricing, support automation and efficiency gains, and enable large-scale production facilities if they want competitive domestic manufacturing.
2. Supply Chain Diversification
Strategic international partnerships for specific supply chain steps, rather than pursuing full vertical integration. The data shows that selective collaboration can close most of the cost gap while building resilience:
- EU + North Africa for solar wafers: approximately 20% cost reduction
- Europe + India for wind components: closes 75% of the cost gap with China
- US near-shoring for battery and EV manufacturing: demonstrable progress in five years
Full vertical integration (every step of the supply chain domestically) is economically unviable for most regions. Targeted partnerships — choosing specific supply chain steps where collaboration delivers both cost efficiency and resilience — offer the realistic path.
3. Mid-Stage Technology Acceleration
Low-emissions hydrogen and CCUS need stronger demand-side policies, infrastructure development, and faster final investment decision timelines. The 90% of CCUS projects stuck in the pipeline represents a critical policy failure — not a technology failure. Hydrogen's tenfold market divergence between STEPS and NZE underscores that policy ambition, not technology readiness, is the limiting factor.
4. Trade Policy Balance
Trade restrictions have nearly sextupled since 2015, yet global clean energy trade value is projected to more than double by 2035. Only 15% of global imports come from countries with substantially higher tariffs. The challenge is balancing diversification with cost efficiency. Tariff impacts are partially offset by falling commodity prices (battery materials, polysilicon). The IEA's implicit recommendation: trade policy should support selective diversification, not blanket protectionism.
5. Grid Infrastructure
The NZE scenario requires approximately 2 million kilometres of new transmission and distribution network per year. Grid investments must rise roughly 60% above current levels. This is increasingly the binding constraint on renewable deployment. Governments must prioritise grid expansion with the same urgency applied to renewable generation — otherwise, solar farms and wind turbines will sit idle, waiting for connection.
> "The cost gap with China is not primarily about technology — it is about manufacturing scale and input costs. Strategic partnerships can close most of the gap."
The IEA is framing pragmatic, evidence-based pathways. Not ideological. Not alarmist. Selective collaboration, not autarky. Faster execution, not wishful thinking.
The Age of Constraint as the Defining Challenge
The energy transition has entered a new phase. The question is no longer "can we?" but "can we fast enough?" This is the Age of Constraint — not because the technology isn't ready, but because execution must accelerate beyond historical precedent.
The solar factory in Bavaria didn't close because solar panels don't work. It closed because the global energy system is fragmenting politically while remaining deeply integrated economically. China's dominance is a structural reality driven by scale, cost, and energy pricing. Grid infrastructure lags deployment capacity. Policy execution is inconsistent — 90% of CCUS projects stuck pre-FID, Net-Zero Industry Act targets not being met, hydrogen market diverging tenfold between scenarios.
But — and this is the balanced conclusion — these are solvable constraints. Not easy. Not quick. But solvable.
Strategic partnerships can reduce supply chain vulnerability. The EU + North Africa solar wafer collaboration demonstrates a 20% cost reduction. Europe + India wind component partnerships close 75% of the cost gap with China. The United States has shown that industrial policy (IRA) can shift manufacturing trajectories within five years.
Grid investment can accelerate if policy prioritises it with the same urgency applied to renewable generation. The 2 million kilometres per year target is ambitious, but transmission technology is mature — this is a financing and coordination challenge, not a technical one.
Hydrogen and CCUS can move from pipeline to deployment if final investment decision timelines compress and demand-side policies strengthen. The 90% of CCUS projects stuck pre-FID is a policy execution failure, not a technology readiness failure.
The economics already work. 80% of solar PV and wind generation is cheaper than coal or gas. The clean energy market will reach USD 3 trillion by 2035 under STEPS — the "most likely" trajectory. The technology is proven.
The central tension remains: the technologies exist, the economics are favourable, but supply chains, infrastructure, and policy execution threaten to constrain the pace of change. The IEA's implicit warning is clear — the energy transition is no longer constrained by what we can build, but by what we can build fast enough, with supply chains that are resilient enough, supported by policy that is coherent enough.
> "The energy transition has moved from 'can we?' to 'can we fast enough?' The answer depends not on technology — but on whether governments, industries, and supply chains can execute at the speed the climate demands."
This is the Age of Constraint. The question is whether we can execute our way out of it.
Sources
IEA Core Reports
* Energy Technology Perspectives 2026 — Executive Summary — Core findings on USD 3 trillion market projection, 80% cost parity achievement, and supply chain concentration risks
* Energy Technology Perspectives 2026 — Full Report — Complete analysis of clean energy technology markets, scenario modeling (CPS/STEPS/NZE), and regional divergence
* Supply Chain Risks and Industrial Competitiveness — Detailed dissection of China's 85-97% dominance, cost gap analysis, and strategic partnership pathways
* The State of Energy Innovation 2026 — Mid-stage technology acceleration priorities including hydrogen and CCUS execution gaps
Scenario Frameworks
* Net Zero Emissions by 2050 Scenario (NZE) — Normative pathway showing 10x hydrogen market divergence and 25x clean materials gap vs. STEPS
* Net Zero by 2050 Roadmap — Grid infrastructure requirements (2 million km/year transmission expansion) and policy execution benchmarks
Analysis & Commentary
* Strengthening Supply Chains Press Release — IEA announcement highlighting USD 17 billion one-month battery disruption impact and Strait of Malacca chokepoint
* The Age of Electricity Meets the Age of Constraint — Third-party analysis framing the paradox: technology ready, economics favorable, but execution constrained
* Energy Technology Perspectives 2026: Independent Review — Coverage of heat pump market growth (USD 50 billion) and regional manufacturing trajectories
* IEA Flags Gaps in Global Energy Supply Chains — Industry response to supply chain vulnerability findings and diversification recommendations
Technology-Specific Analysis
* Low-Emissions Hydrogen Growth Analysis — Electrolyser capacity trends (5 GW installed, 65 GW projected by 2030) and policy-dependency evidence
* Heat Pumping Technologies in ETP 2026 — Deep-dive on 145 GW production capacity distribution and "quiet revolution" market dynamics
* IEA Features Fusion in Innovation Report — Long-term technology portfolio context showing fusion's position in mid-stage acceleration priorities